Every company has a dashboard, and until recently they all answered the same question: how did we do? Revenue this month, pipeline this quarter, hours billed, leads in the funnel. Lagging indicators, read after the fact, like a rear-view mirror. When we wired Claude into how Prism actually runs, that dashboard quietly stopped being the one we needed — not because the numbers were wrong, but because they were no longer the numbers that explained how the work was going.
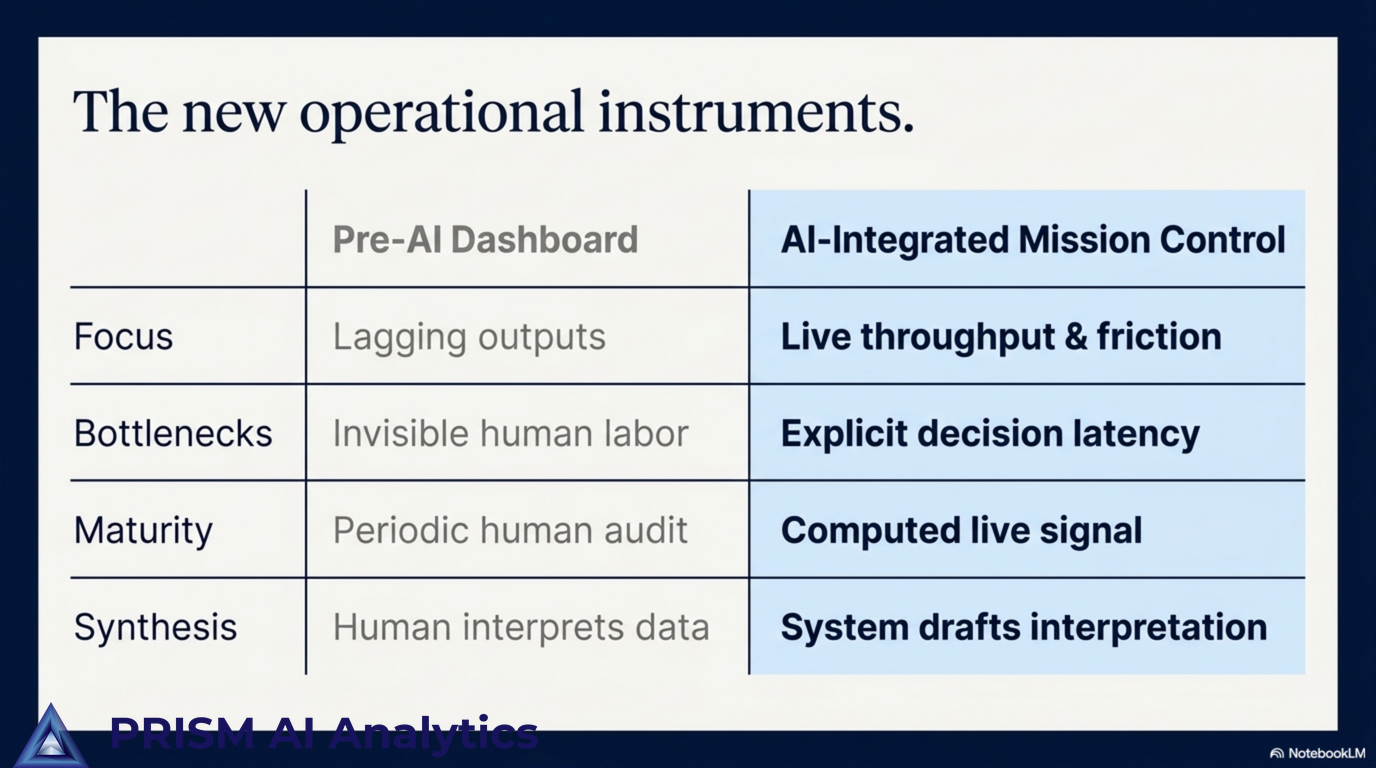
This post is about what a Mission Control surface looks like when a business runs with AI wired into the work itself, and why it is a genuinely different instrument from the dashboard a pre-AI company carries. The short version: when you change how the work gets done, you change what is worth measuring. The dashboard is downstream of the operating model. Bolt an AI tool onto a pre-AI dashboard and you will measure the old company faster. You will not see the new one.
The dashboard is downstream of the operating model
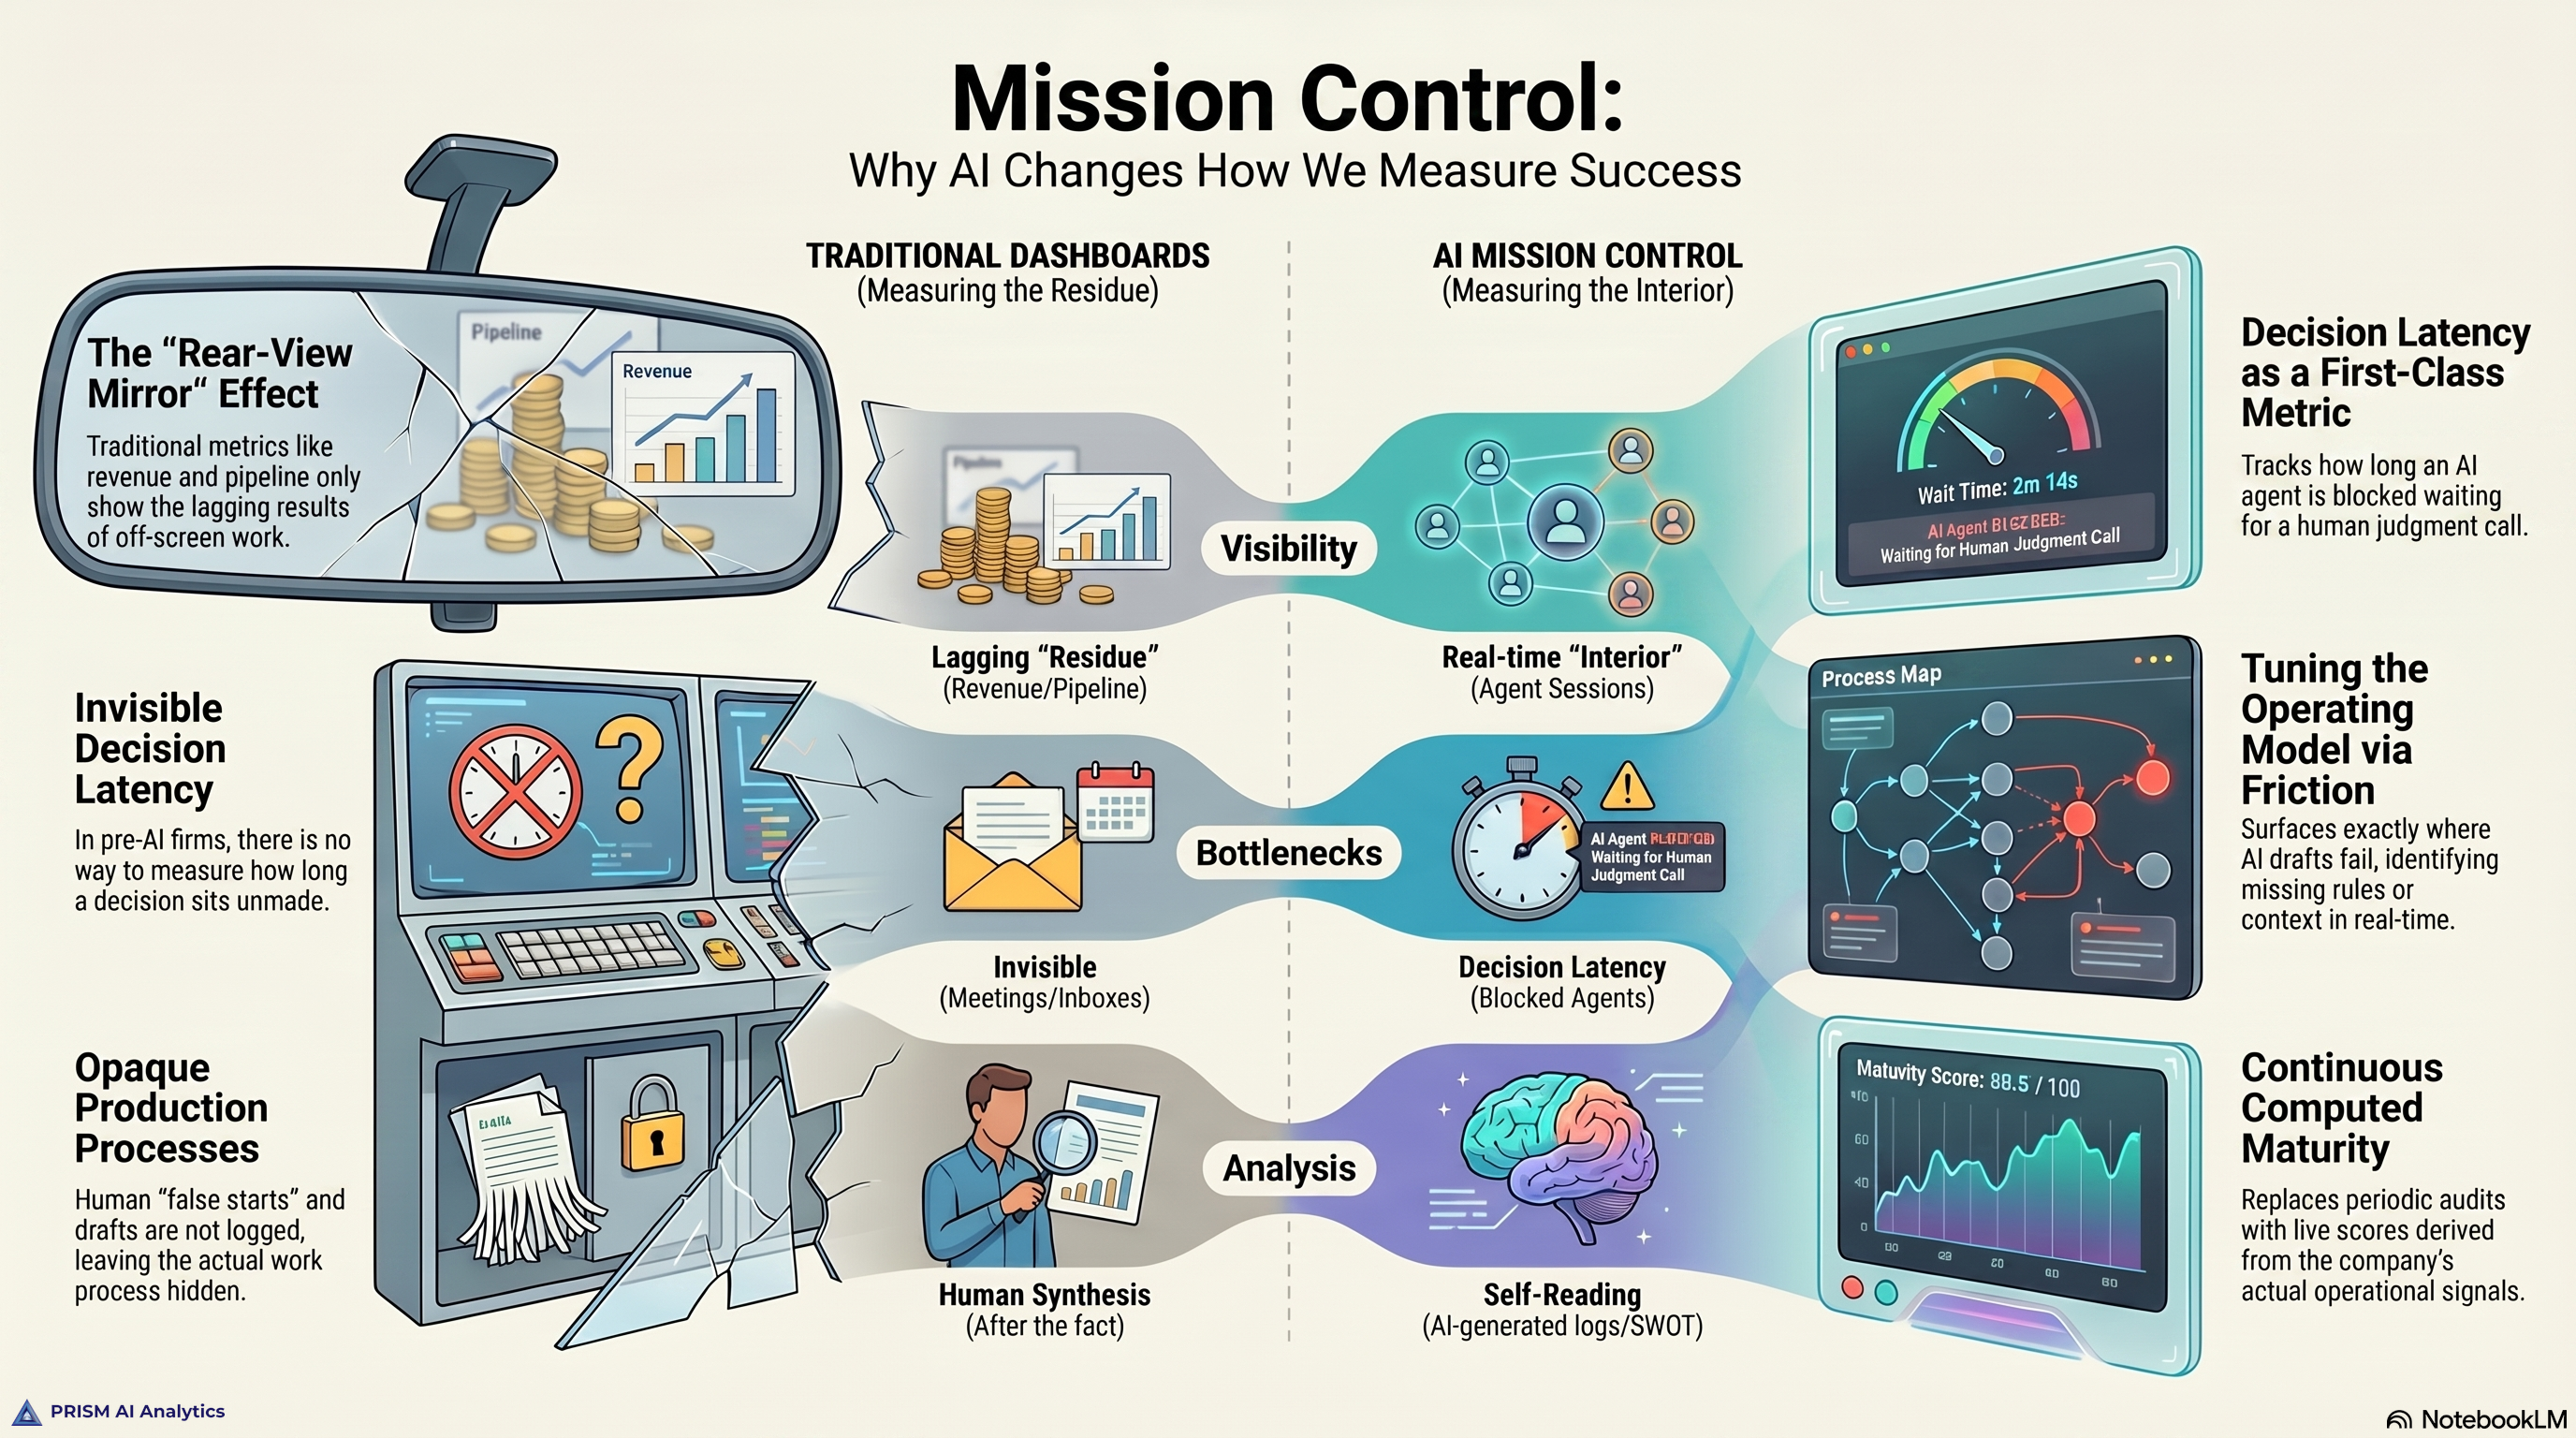
A traditional business dashboard rests on an assumption so old nobody states it: the work is done by people, in ways the dashboard cannot see, and the numbers are the residue that work leaves behind. Revenue is the residue of selling. Pipeline is the residue of outreach. The dashboard reports the residue. The work itself — the decisions, the drafts, the back-and-forth — happens off-screen, in heads and meetings and inboxes.
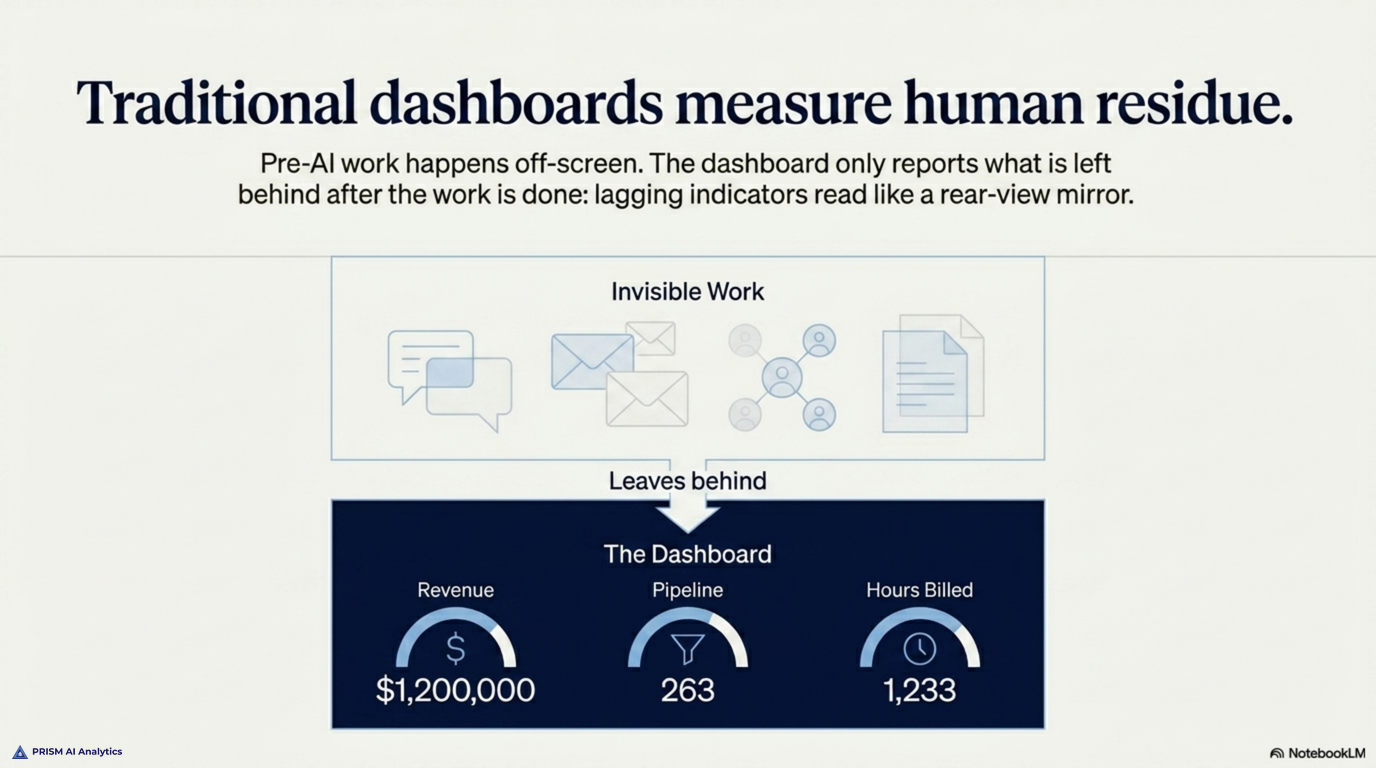
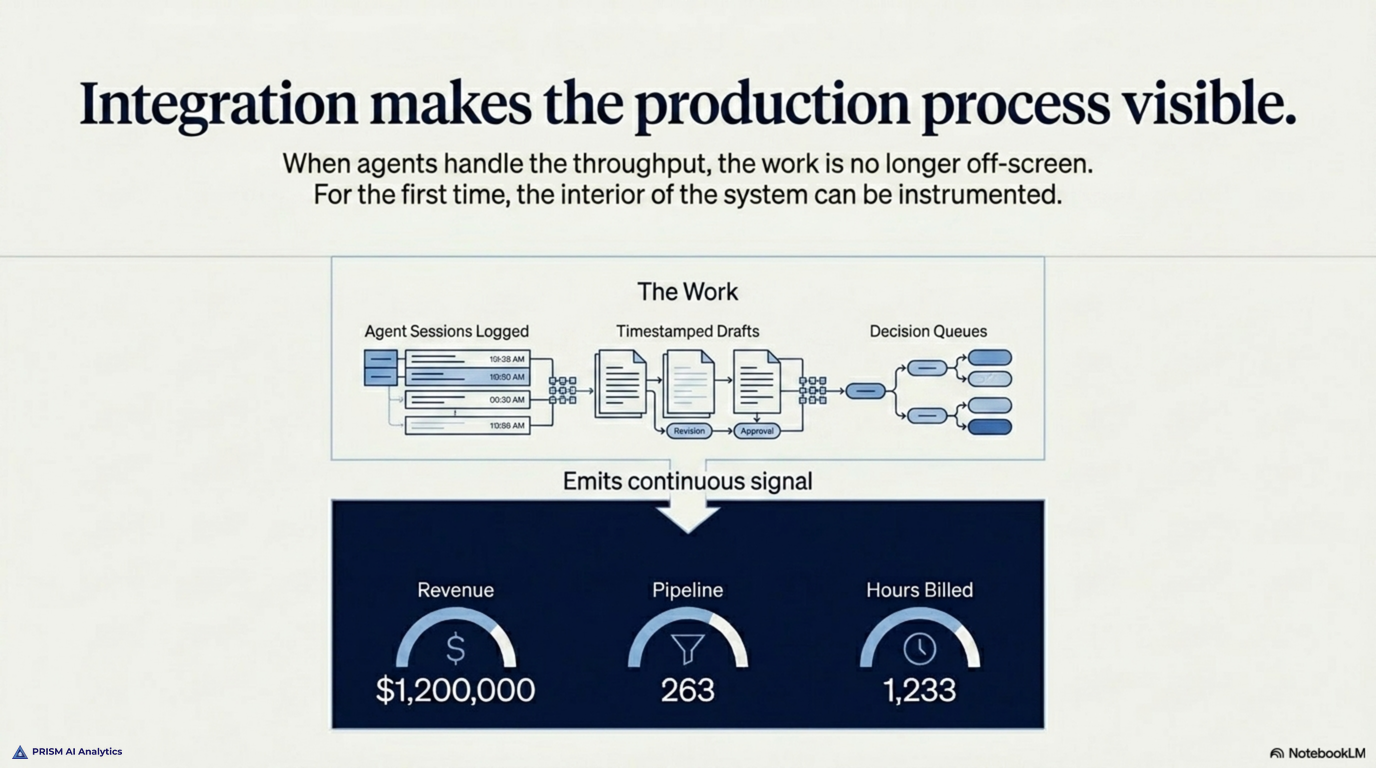
When agents do a meaningful share of the throughput, that assumption breaks in a useful way. The work is no longer off-screen. An agent session is logged. A decision an agent is waiting on is a record, not a hallway conversation. A draft swept against the brand rules is an event with a timestamp. For the first time, the production process of a small firm is instrumented — not just its financial residue. A dashboard that only shows revenue and pipeline is now showing you the thin outer layer of a system whose interior is, finally, visible. Mission Control for an AI-integrated company is the surface that shows the interior.
Here is what that interior holds that a pre-AI dashboard structurally cannot.
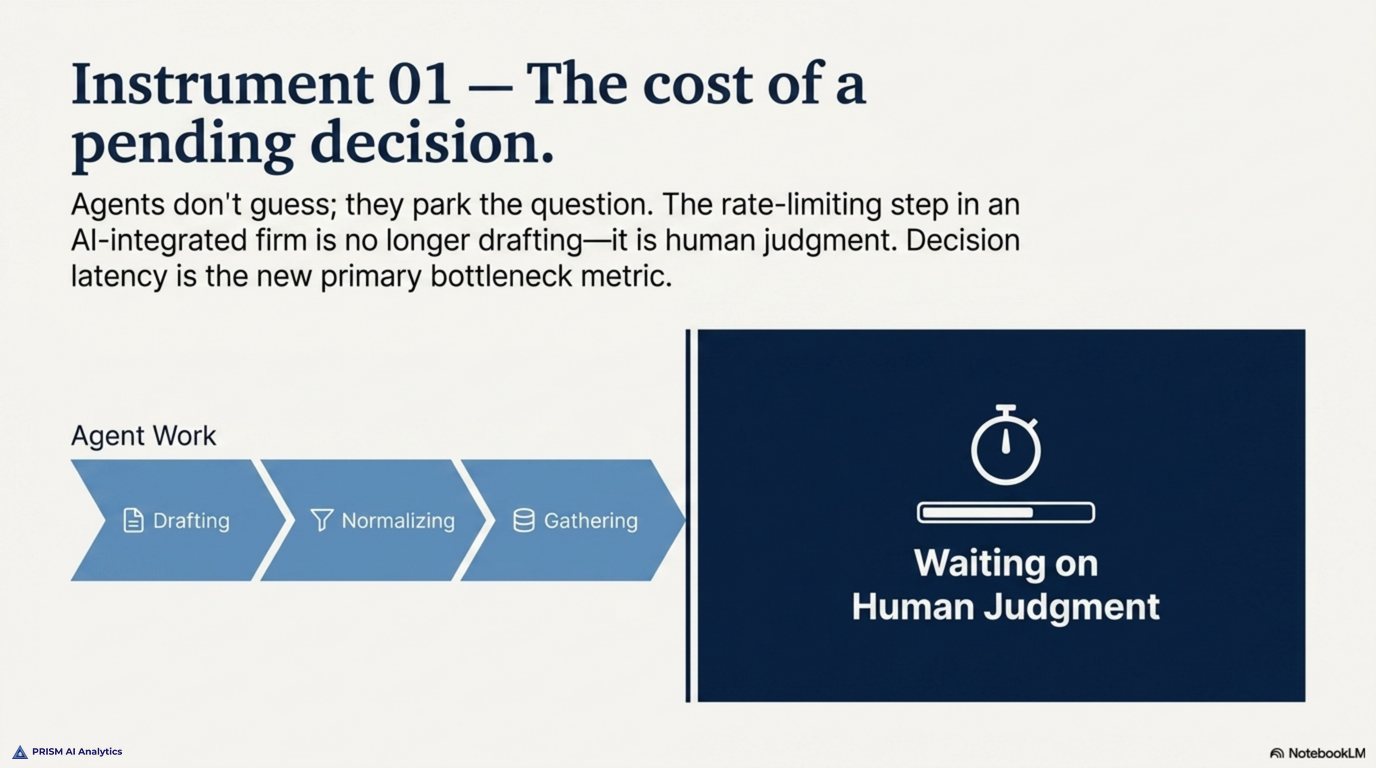
New instrument: the cost of a decision
In a pre-AI company, decisions are invisible to the dashboard. They happen in a meeting, a thread, a moment of judgment in someone’s afternoon. Nobody measures how long a decision sat unmade, because no surface knew a decision was pending.
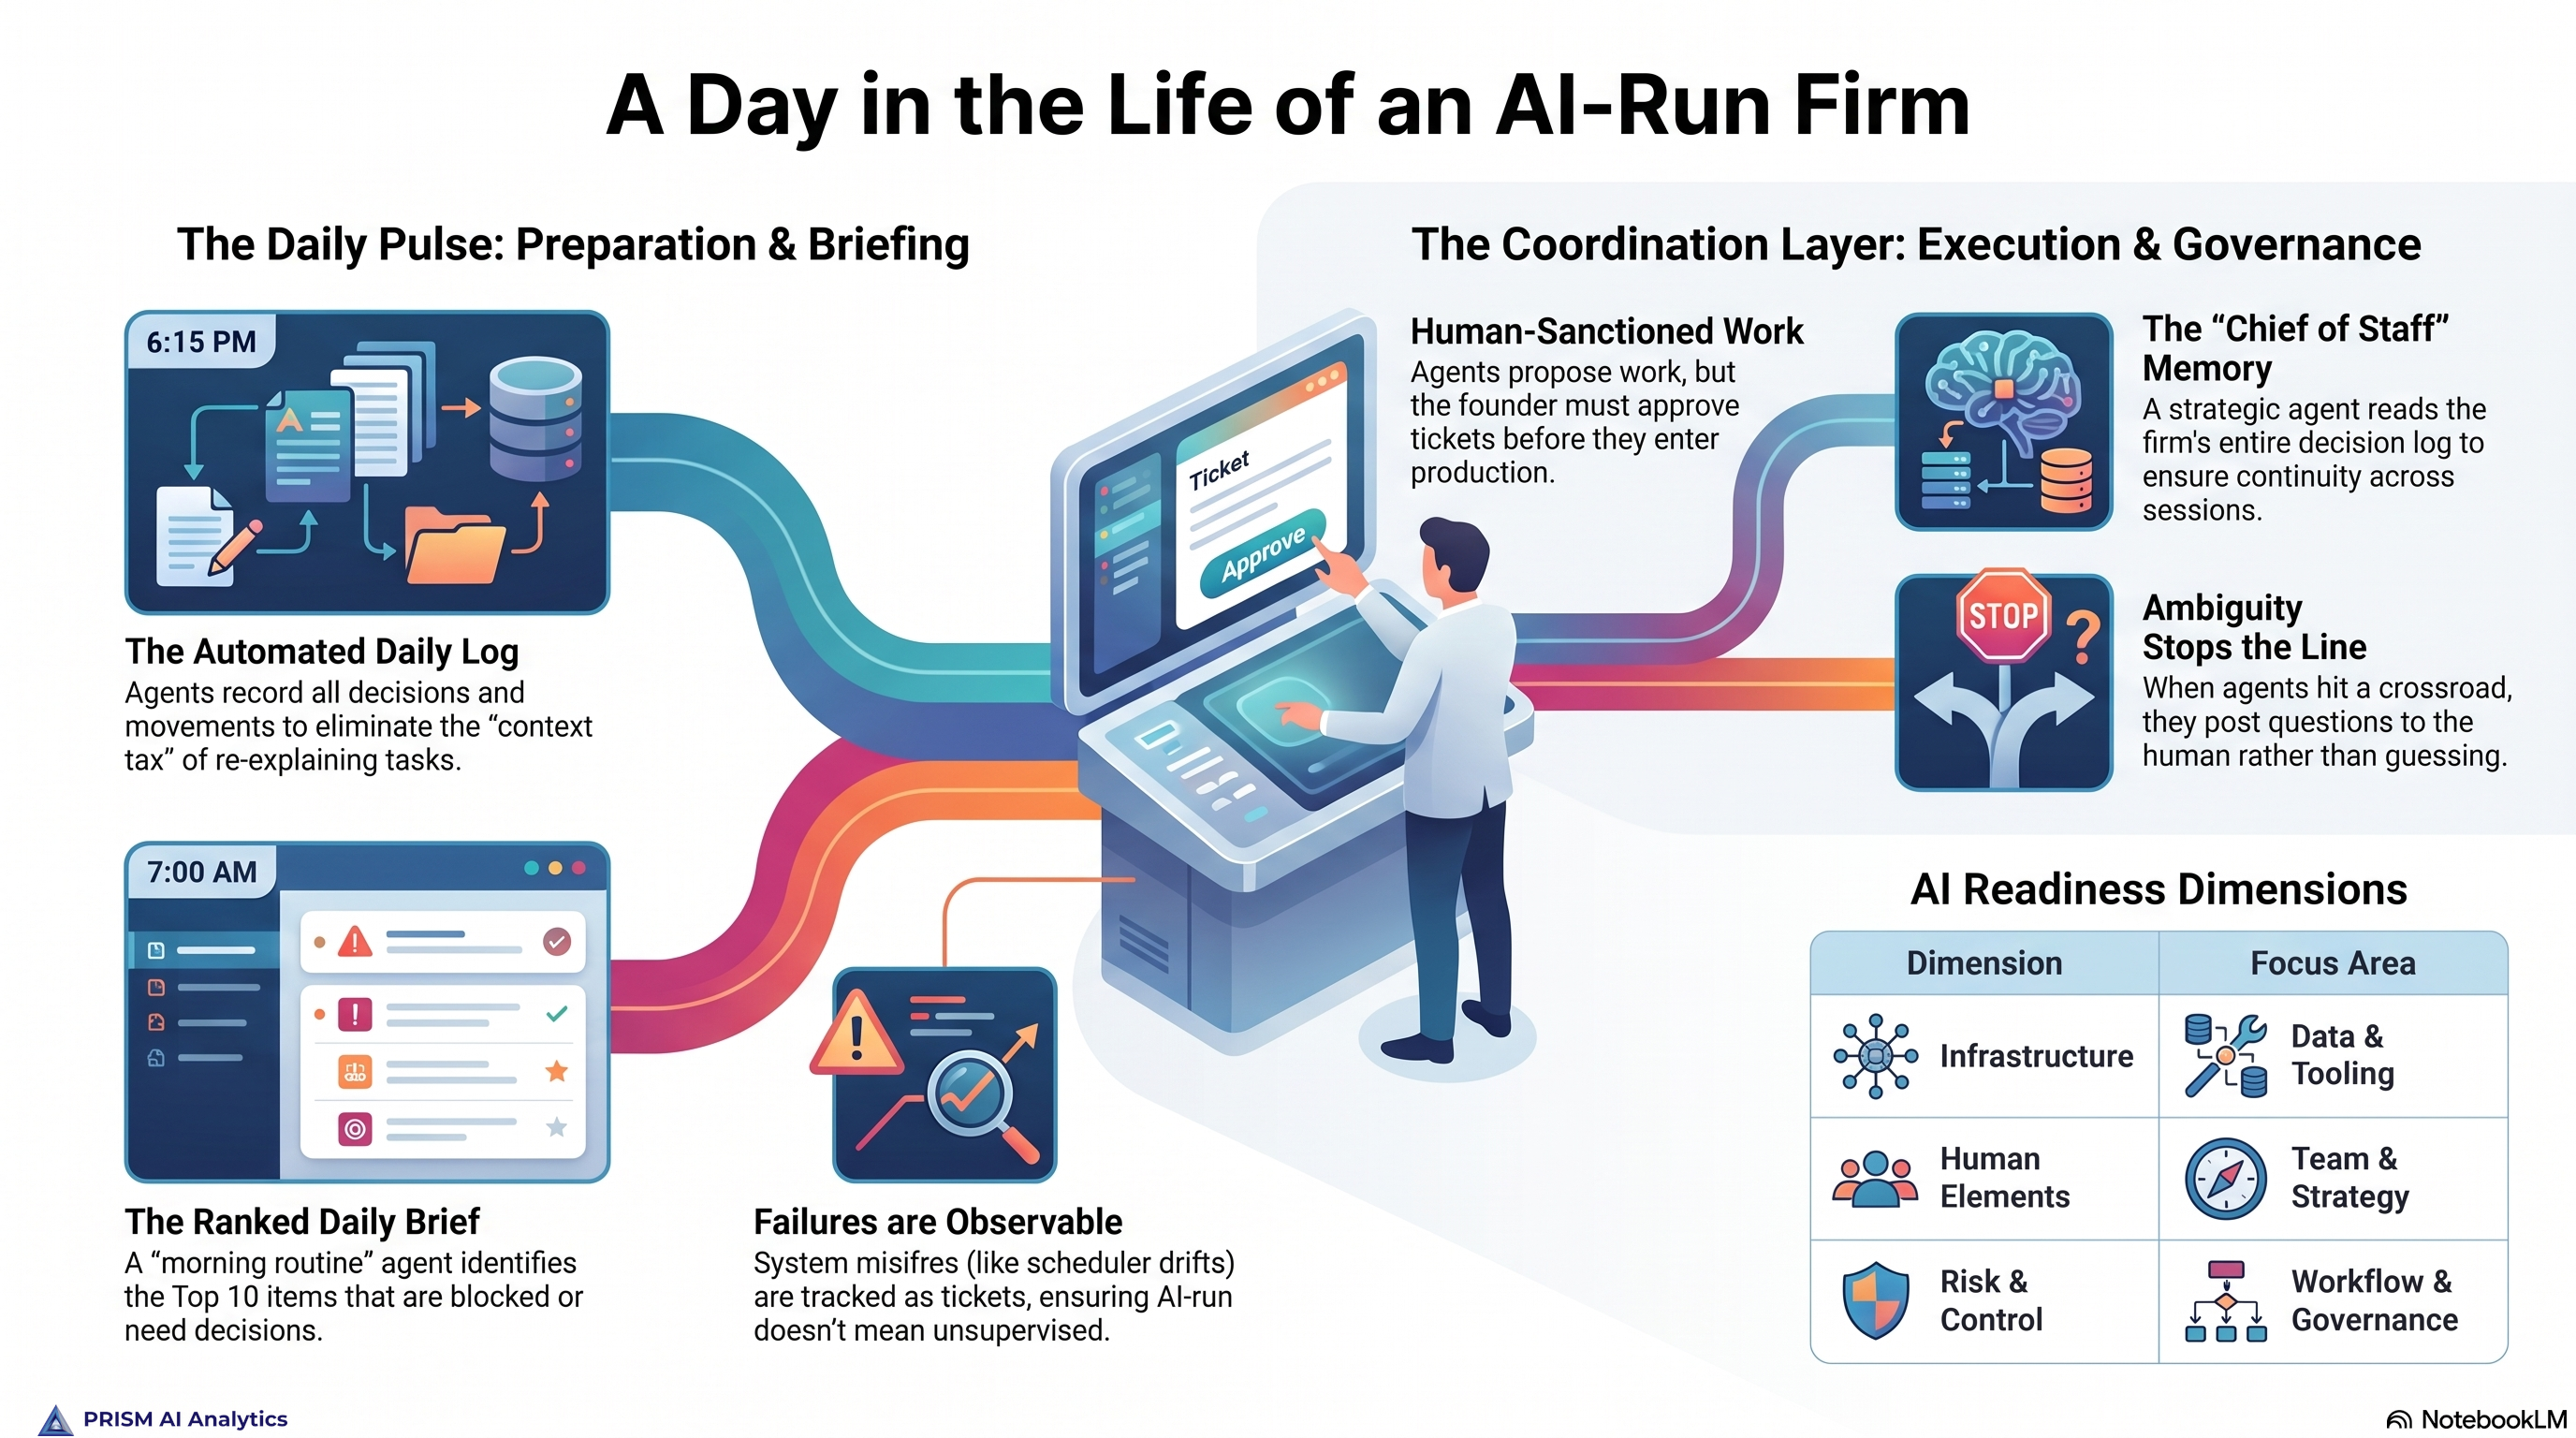
When agents do the work, the bottleneck moves. The agent drafts the proposal, normalizes the data, writes the first version — and then hits the one thing it should not do alone: a judgment call. Which of three directions for the client. Whether the pricing is right. At that moment a well-built agent does not guess; it parks the question and waits. And the thing it is waiting on — a human decision — is now the rate-limiting step in the whole system.
So the AI-integrated dashboard grows an instrument no pre-AI dashboard had: a live count of open decisions the work is blocked on, and how long each has waited. Decision latency becomes a first-class metric. It is the new bottleneck dial — the equivalent of a factory’s work-in-progress gauge, except the work in progress is judgment, and the thing standing idle is an agent that has done everything it can until a person weighs in. A pre-AI dashboard has no needle for this, because in a pre-AI company nothing was waiting on you in a way anything could see.
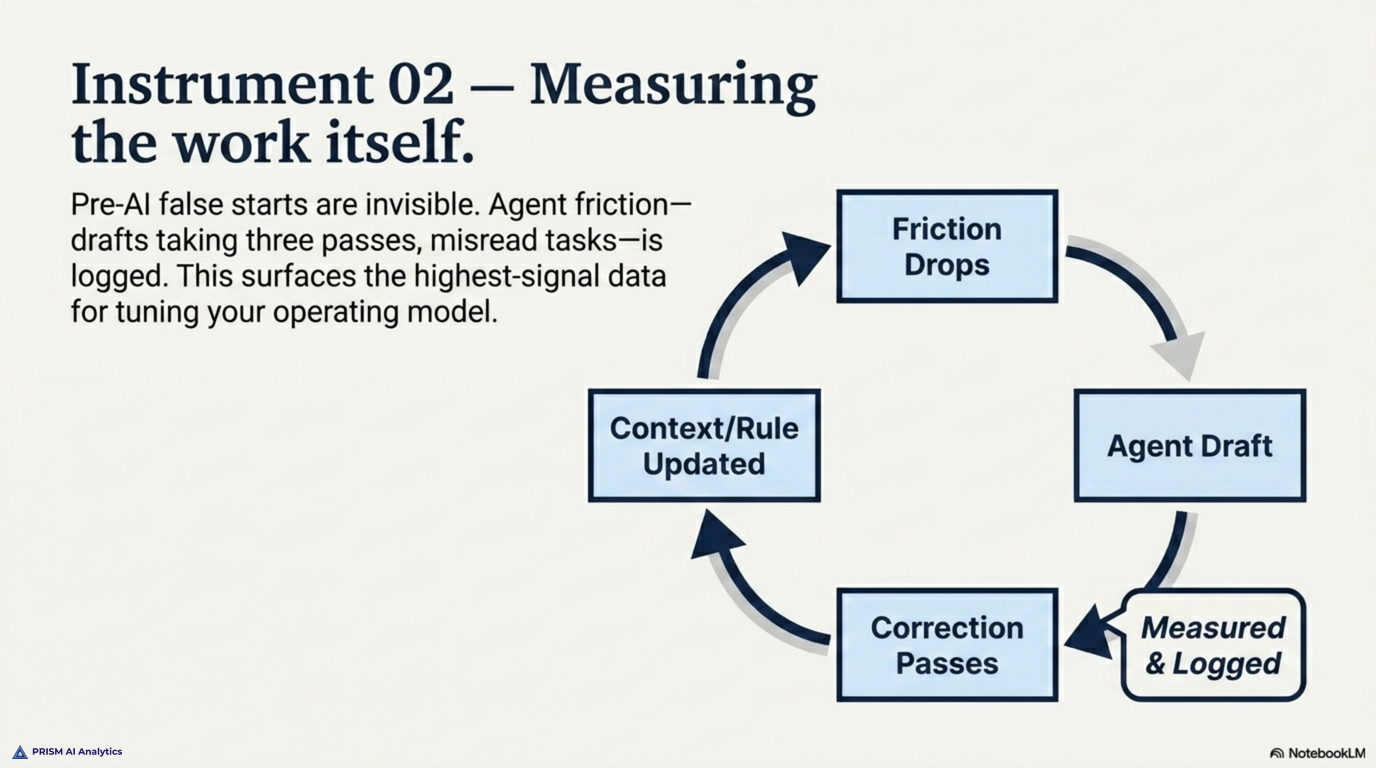
New instrument: the work itself, measured
Pre-AI, you measure labor by its output and infer the rest. You see the deck that got made; you do not see the six false starts. The process is opaque by default.
An agent-integrated process is transparent by default, and that changes what the dashboard can hold. It can show throughput — how much work moved through the agent layer this week — but more usefully, it can show friction: where work went wrong and why. A draft that took three correction passes. A task the agent misread. A category of request that reliably produces a poor first answer. Those are not failures to bury; they are the highest-signal data a small firm has ever had about its own operations, because they point straight at the rule that is missing or the context that was not provided.
A pre-AI dashboard cannot show this, for the plain reason that human false starts are not logged. The agent’s are. The result is a maintenance loop a traditional company never gets to run: the dashboard surfaces where the system produces friction, you fix the rule or the context, and the friction drops. You are tuning the operating model using data the operating model emits about itself.
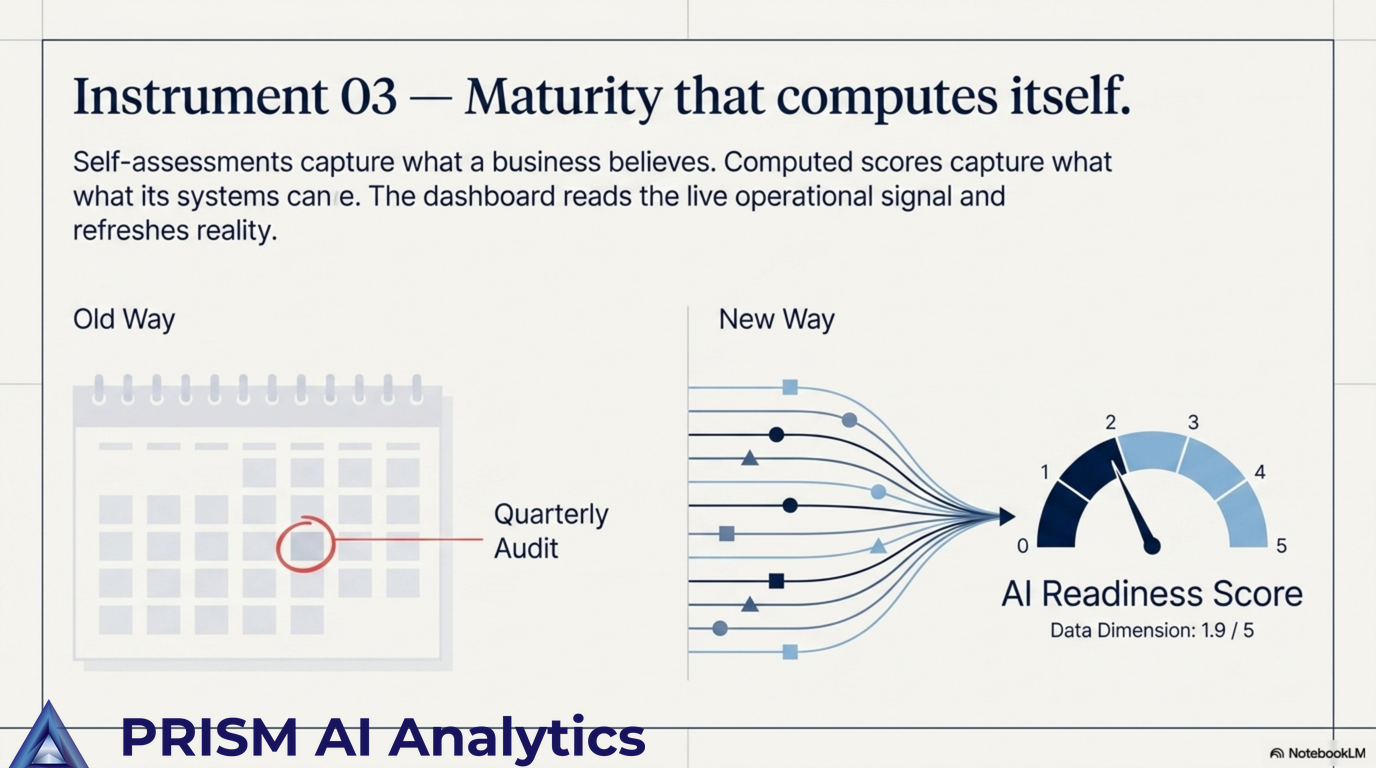
New instrument: maturity that computes itself
Most businesses learn where they stand through an event — a consultant, an audit, a quarterly review. Someone comes in, asks questions, and hands back an assessment that is accurate the day it is written and decays from there.
An AI-integrated Mission Control can compute that assessment continuously, from signals it already holds. Is the accounting actually connected. Is the pipeline being worked. Is content actually shipping. Instead of asking the business to rate itself, the dashboard reads the live operational signal and scores it — financial operations, sales, marketing — and refreshes when the underlying reality changes. A self-assessment captures what a business believes about itself; a computed score captures what its systems can prove. The gap between the two is one of the more honest things a founder can look at on a Monday, and it exists only because the systems are wired tightly enough to be read.
This is the same shift, again: a thing that used to be an external, periodic event becomes an internal, continuous surface — because the integration makes the underlying signal legible in real time.
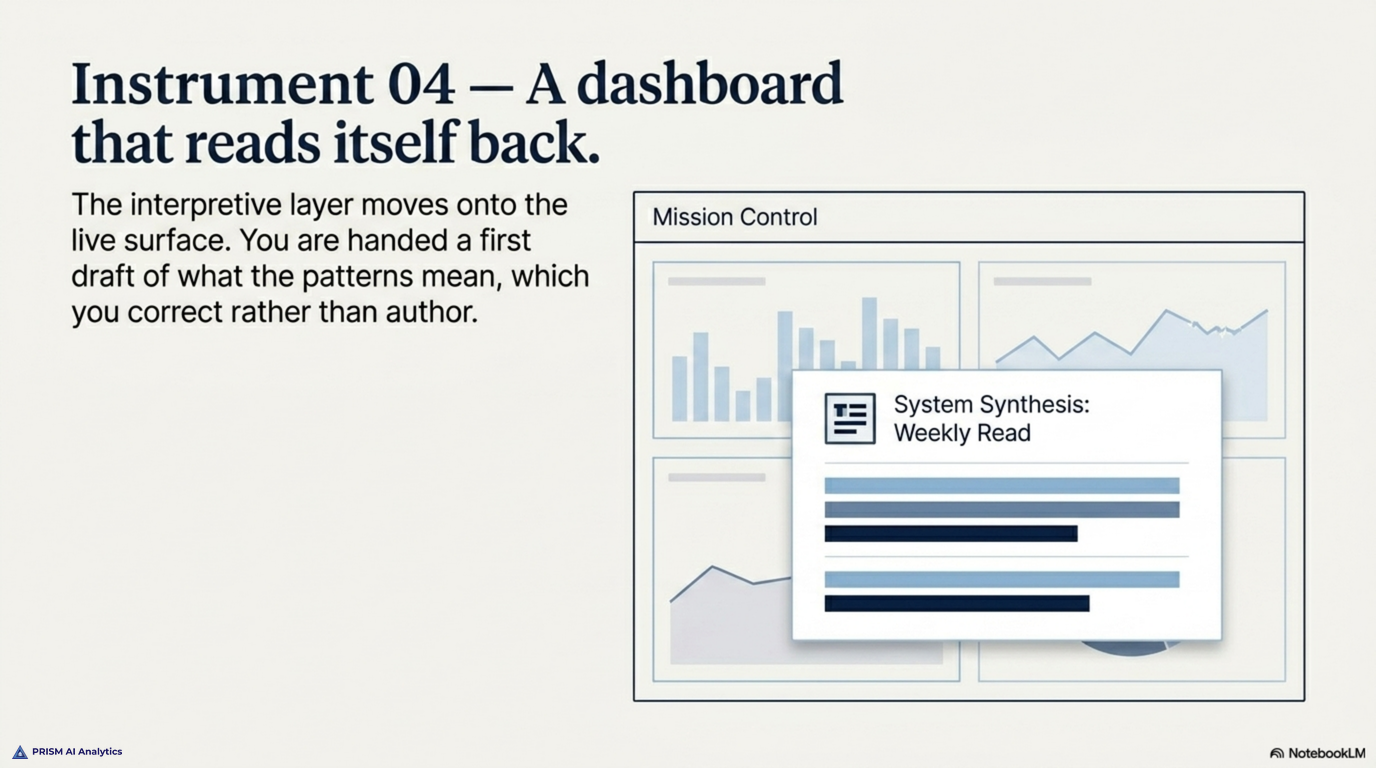
New instrument: a dashboard that reads itself back
Here is the one with no pre-AI analog at all. A traditional dashboard shows you data and leaves the interpretation to you. That is the deal: the tool displays, the human synthesizes.
When the firm runs with an AI layer, the synthesis can live on the surface too. The daily log is written by the system, not typed up at end of day. A weekly read of what changed — new patterns, hypotheses worth holding, decisions that got made twice — is generated, not manually compiled. A SWOT derives on demand from the scores already present. The dashboard stops being only a set of gauges and becomes, in part, a reader of its own gauges. You are not just handed the numbers; you are handed a first draft of what they mean, which you correct rather than author.
A pre-AI company cannot put this on its dashboard, because nothing in the stack writes. The interpretive layer was always a person, after the fact, on their own time. Moving it onto the live surface is not a feature — it is a different relationship with your own data.
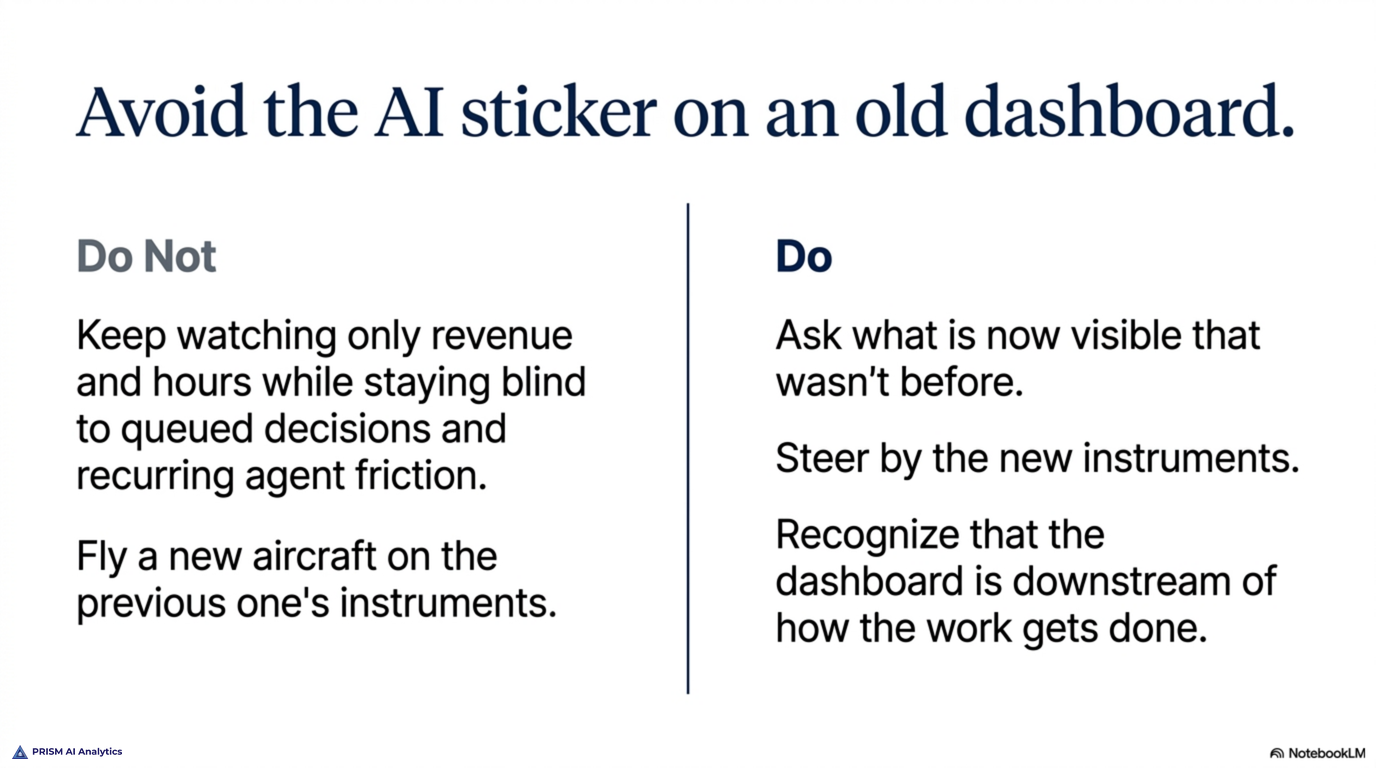
The trap: an old dashboard with an AI sticker
The failure mode is predictable, and we nearly walked into it. You adopt AI tools, the work starts changing shape, and you keep watching the same dashboard — revenue, pipeline, hours. It still works. It still shows real numbers. And it quietly tells you nothing about the part of your company that is now different: the decisions queued, the friction recurring, the maturity drifting, the synthesis nobody is reading. You optimize the metrics you can see and stay blind to the system you actually built.
The point is not that the old numbers stop mattering. Revenue still matters. The point is that they are now the outer layer, and an AI-integrated company has an interior worth watching that the old dashboard was never built to show. A dashboard is downstream of how the work gets done. Change the work, keep the old dashboard, and you are flying a new aircraft on the previous one’s instruments.
What this actually means
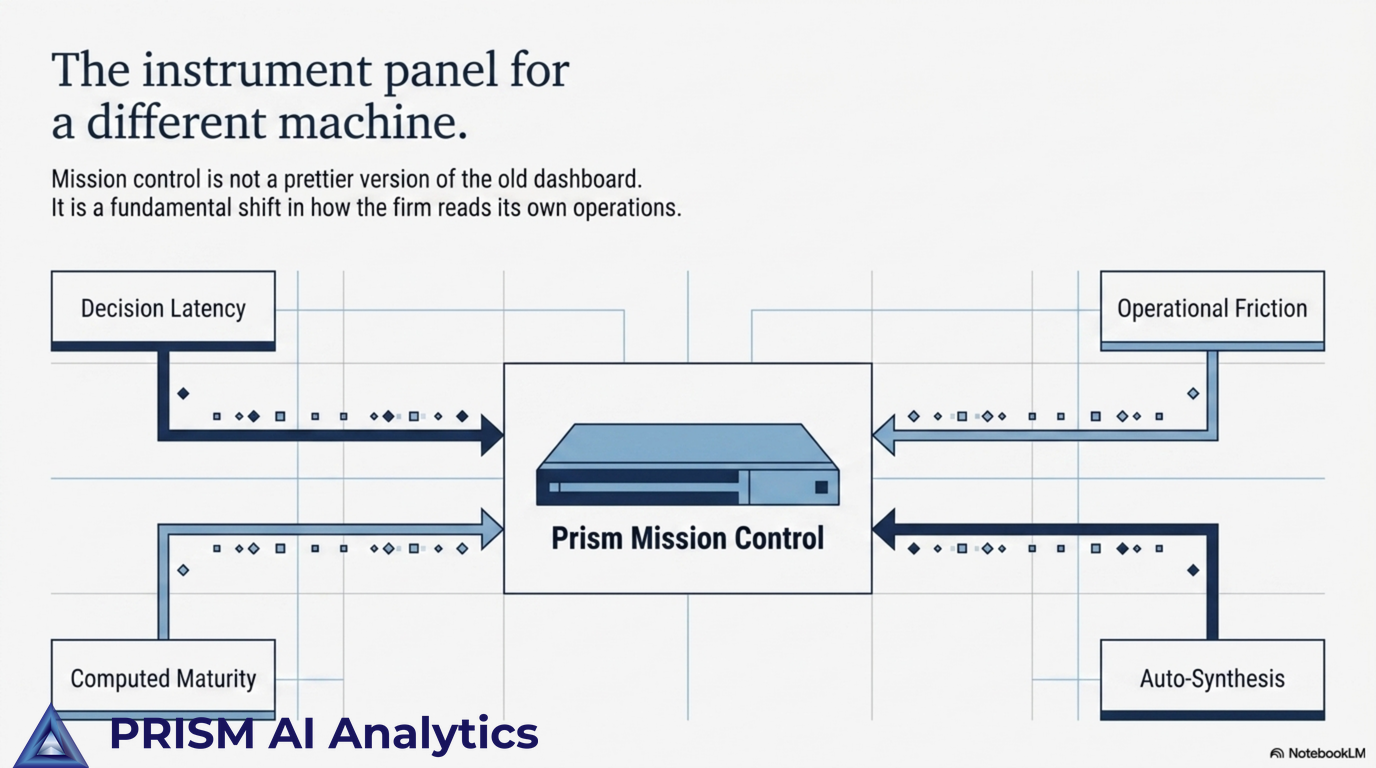
If your business is integrating Claude, or any agent layer, in a serious way, the dashboard question is not how do we add an AI tab. It is what is now visible that was not before, and which of those things should we be steering by. For us the answers were decision latency, operational friction, computed maturity, and synthesis on the surface — four instruments that did not exist in any dashboard we ran before this year, because the work that produces them did not exist either.
Mission Control for an AI-integrated company is not a prettier version of the old dashboard. It is the instrument panel for a different machine.
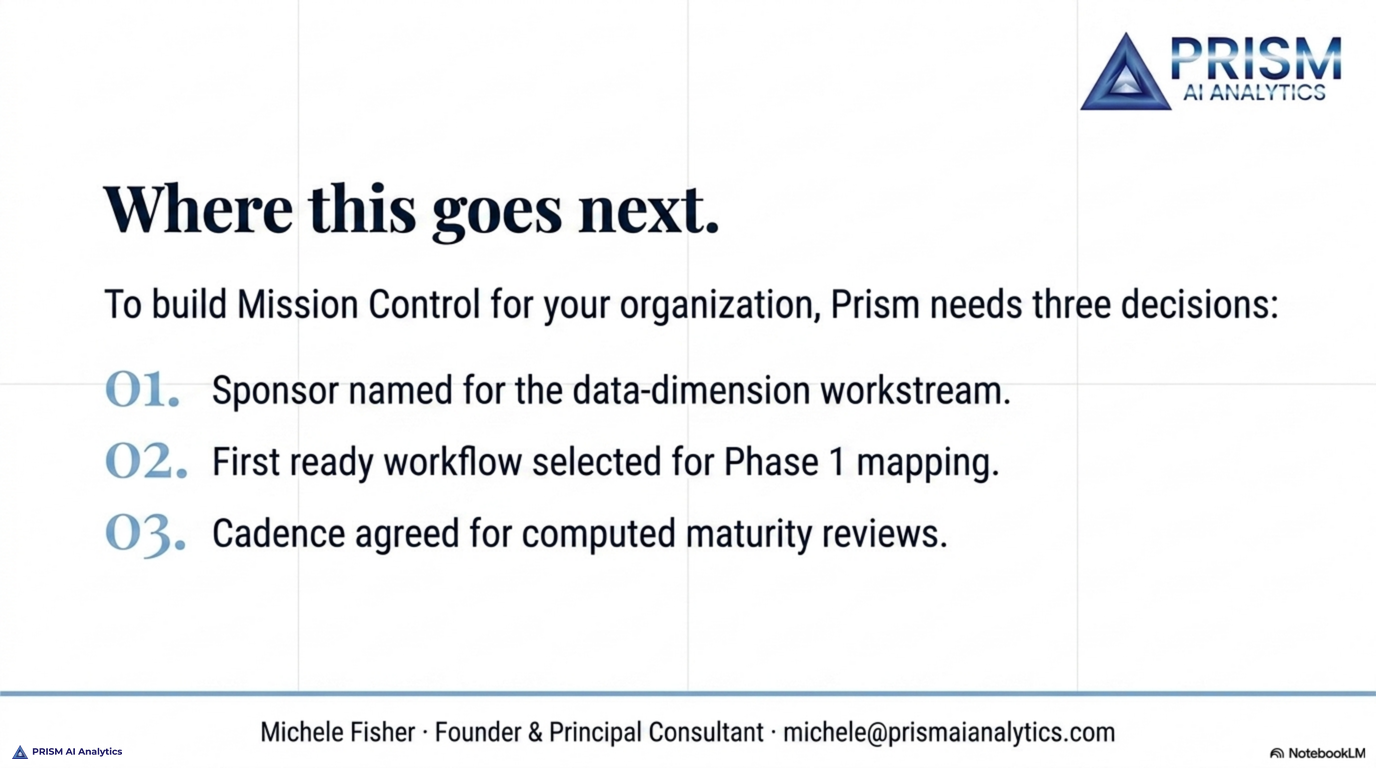
Building Mission Control for an AI-integrated business?
Prism AI Analytics designs the operational surfaces small teams need once Claude is wired into the work — the dashboards, metrics, and synthesis layers that show the company you actually built, not the one you used to run.